Utilizing Heat Map Visualizations from Aggregated Player Deaths to Refine Navigation Aids in Precision Platformers
Written by Wendy Krause · Jun 5, 2026

Utilizing Heat Map Visualizations from Aggregated Player Deaths to Refine Navigation Aids in Precision Platformers
Precision platformers rely on tight controls and pixel-perfect timing, yet developers now draw from large-scale telemetry to identify where repeated failures occur and to adjust guidance systems accordingly. Aggregated player death data forms the foundation for heat map visualizations that reveal high-density zones of repeated player failure across thousands of sessions. These maps convert raw positional logs into color-coded overlays, with warmer tones marking areas where navigation proves most challenging for the player base.
Data Aggregation Methods in Modern Platformer Development
Studios collect death coordinates through built-in analytics frameworks that record exact positions, velocities, and input states at the moment of each failure, then anonymize and pool the information across regional servers. In June 2026 several mid-sized developers reported processing over 2.4 million death events per title within the first month of early access releases, allowing teams to generate reliable density models within days rather than weeks. Researchers at the University of Alberta documented similar pipelines in a 2025 technical report that examined telemetry from three independent precision platformer projects.
Filtering steps remove outliers such as intentional speedrun deaths or controller-disconnect events, leaving datasets focused on genuine navigation attempts. The resulting heat maps display not only static hotspots but also temporal patterns, showing how death locations shift after each patch iteration or after players unlock new movement abilities.
Translating Visualizations into Navigation Aid Placement
Designers examine heat map clusters to determine where subtle directional cues or checkpoint adjustments will reduce repeated failures without removing the core challenge. One common technique places faint arrow indicators or temporary visual highlights along routes leading into dense death zones, guiding players toward safer approach angles while preserving the precision demanded by the genre. Another method repositions mid-air recovery platforms or adjusts camera framing so that upcoming obstacles remain visible earlier, directly addressing the sightline problems revealed by concentrated red zones on the maps.
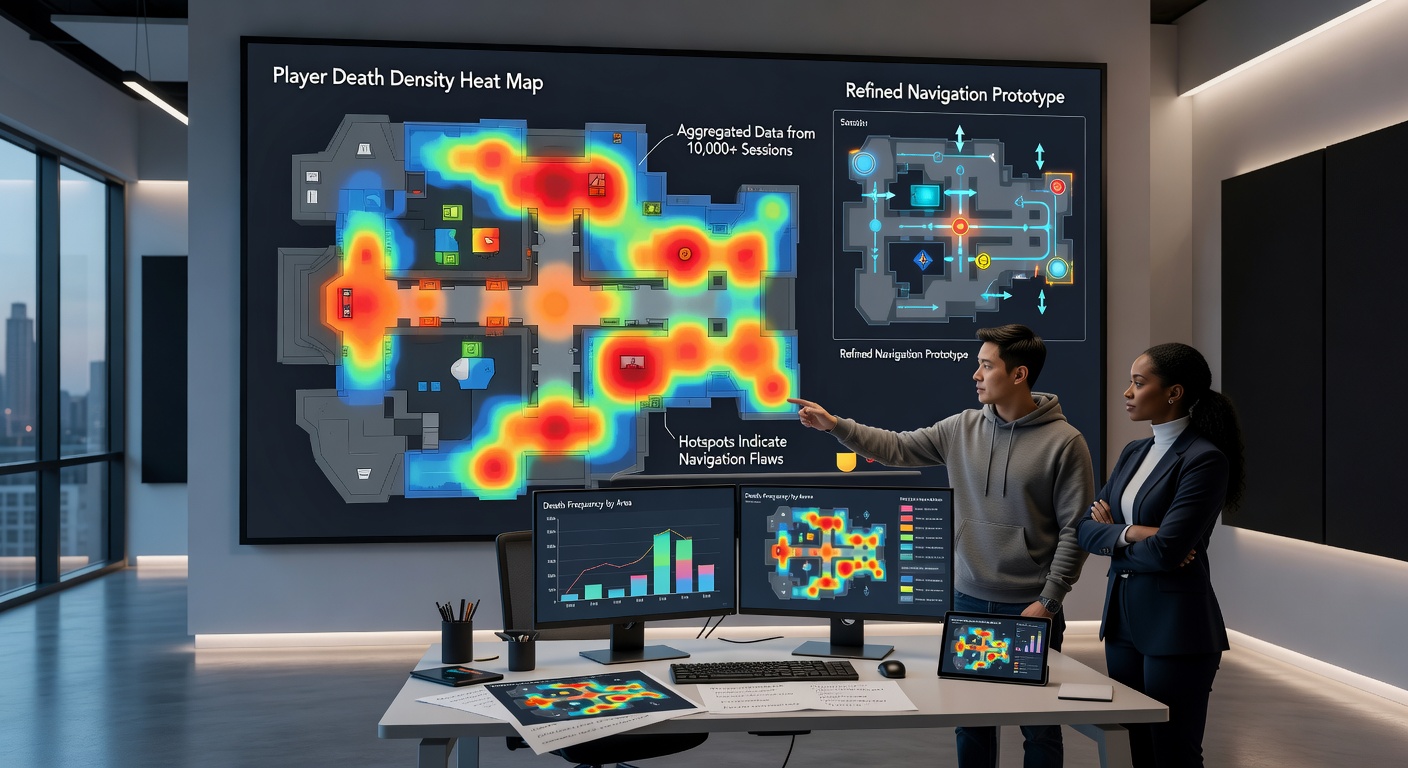
Teams often iterate by generating new heat maps after each aid implementation round, measuring whether the original clusters dissipate or migrate to different sections. This closed-loop process continues until death density falls below a chosen threshold that still maintains intended difficulty curves. Observers note that the approach mirrors methods used in other simulation fields where spatial failure data informs incremental environmental adjustments.
Case Examples from Recent Releases
Take one independent studio that released a pixel-art precision platformer in late 2025. Their internal logs showed a single vertical shaft section accounting for 31 percent of all recorded deaths during the first week. After overlaying the heat map on the level editor, designers added two low-contrast wall markings that indicated optimal wall-jump timing windows. Subsequent data releases indicated that the same shaft's death share dropped to 12 percent while average completion time remained nearly unchanged.
Another example comes from a European collective that maintains a public analytics dashboard for its open-source platformer framework. Contributors published aggregated maps showing how death patterns evolved across different controller types, leading to context-sensitive input prompts that appear only when heat maps detect elevated failure rates among gamepad users. The project documentation references similar practices discussed at the 2025 Game Developers Conference Asia sessions on telemetry-driven level design.
Technical Considerations and Limitations
Rendering performance remains a concern when heat maps must update in real time for live-service titles, so most implementations precompute static layers and stream only delta updates when new data batches arrive. Privacy regulations in multiple jurisdictions require explicit opt-in toggles for death telemetry collection, which can reduce sample sizes in regions with stricter data rules. Analysts therefore apply statistical weighting to compensate for uneven regional participation rates before finalizing aid placements.
Edge cases arise when heat maps highlight sections that experienced players intentionally use for practice, prompting teams to add optional toggles that hide aids for those who prefer raw challenge. Balancing these preferences against accessibility goals continues to shape how navigation refinements reach different audience segments.
Conclusion
Heat map visualizations derived from aggregated player deaths supply platformer teams with concrete spatial data that informs targeted navigation aid adjustments. The workflow moves from raw telemetry collection through visualization, iterative placement, and validation, producing measurable shifts in failure distribution without altering core mechanics. As collection tools and filtering methods mature, the same datasets increasingly support controller-specific and accessibility-focused refinements across the precision platformer genre.