Plotting temperature fluctuation cycles alongside hydration levels to plan expeditions in desert survival simulations
Written by Viktor Günther · Jul 14, 2026
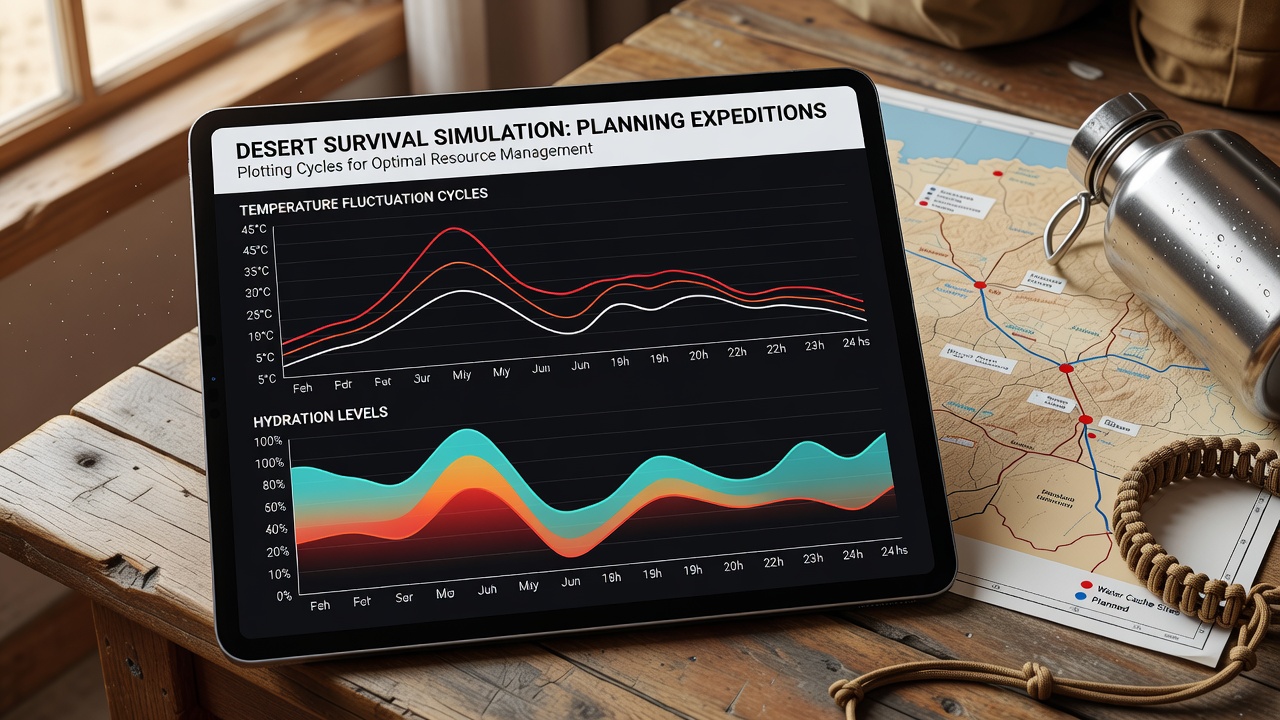
Plotting temperature fluctuation cycles alongside hydration levels to plan expeditions in desert survival simulations
Desert survival simulations incorporate detailed environmental systems where players track temperature fluctuation cycles and hydration levels to determine safe expedition windows. These mechanics draw from real-world meteorological patterns that researchers at institutions like the Australian Bureau of Meteorology have documented across arid regions. Data shows daily temperature swings often exceed 30 degrees Celsius in such environments, which forces players to align movement phases with cooler periods while monitoring fluid reserves through in-game meters.
Simulation engines model these variables using layered algorithms that update every in-game hour. Temperature peaks typically occur between 1400 and 1600 local time, while nighttime lows create brief windows for extended travel. Players who cross-reference these cycles with hydration depletion rates reduce risk exposure during longer routes. The process involves logging readings at fixed intervals and projecting forward based on current inventory and terrain elevation changes.
Core Variables in Desert Simulation Environments
Temperature fluctuation cycles follow predictable sinusoidal curves in most simulation titles, with amplitude modulated by factors such as altitude, wind speed, and cloud cover. Hydration systems run parallel calculations that factor in activity intensity, exposure duration, and carried water weight. When these two data streams intersect on shared timelines, players identify optimal departure and rest points that minimize cumulative strain.
Observers note that successful route planning requires consistent data entry into simulation journals or digital overlays. One documented approach involves marking temperature thresholds at 35 degrees Celsius as hard cutoffs for strenuous activity, while hydration thresholds trigger alerts when reserves drop below 40 percent. These thresholds derive from aggregated player telemetry that developers refine during post-launch updates.
Integration Methods Used by Players
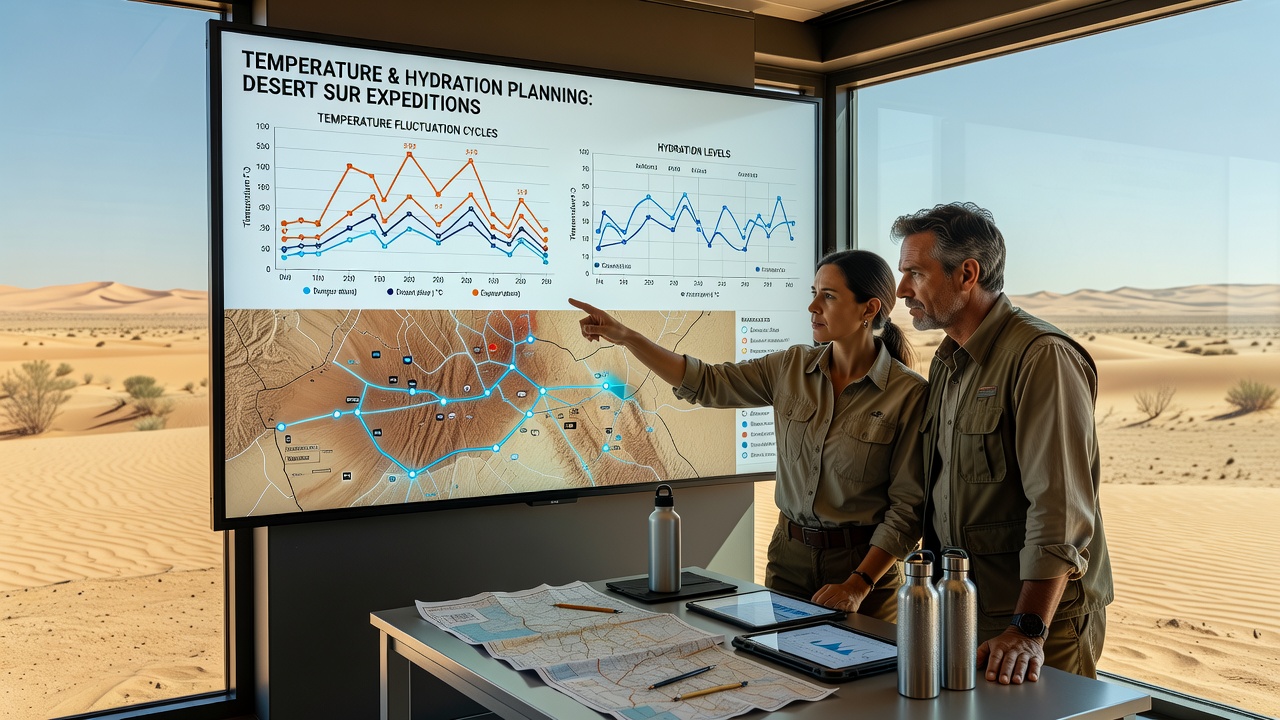
Many simulation communities share standardized plotting templates that combine hourly temperature graphs with hydration consumption tables. These templates allow users to forecast multi-day expeditions by overlaying predicted cycles onto projected movement vectors. Research indicates that players who maintain such records complete objectives with higher resource efficiency compared to those relying on real-time adjustments alone.
Advanced techniques include importing external climate datasets into simulation tools to calibrate in-game models more precisely. Figures from the European Centre for Medium-Range Weather Forecasts provide baseline diurnal range values that enthusiasts adapt for procedural desert generation. This cross-referencing produces expedition schedules that account for rare events such as dust storms or sudden cold fronts that alter both temperature and fluid loss rates simultaneously.
Practical Application Across Simulation Titles
Different titles implement these systems with varying degrees of granularity. Some emphasize manual charting through notebook interfaces, whereas others provide automated graphing tools that highlight safe travel corridors. Players who master both approaches adapt quickly when switching between titles that feature distinct desert biomes or seasonal modifiers.
Expedition planning sessions often begin with baseline data collection over a 24-hour cycle. Users record temperature at dawn, midday, dusk, and midnight while logging hydration drain under different activity states. The resulting datasets feed into simple predictive models that flag high-risk periods. In July 2026 several major simulation platforms released patches that expanded these models to include microclimate variations within single map cells, increasing the value of detailed plotting routines.
Case examples from community archives show groups coordinating multi-player expeditions around synchronized rest stops where shared water caches offset individual depletion curves. These strategies rely on accurate cycle predictions to ensure caches remain accessible during the narrow windows when temperatures permit safe surface activity.
Data Visualization and Decision Support
Effective plotting relies on clear visual representations that combine line graphs for temperature with bar or area charts for hydration reserves. Color coding distinguishes safe, caution, and danger zones across the shared timeline. Players frequently export these visualizations for team review before committing to routes that span multiple in-game days.
Simulation updates continue to refine how environmental data interacts with character statistics. Newer builds incorporate wind direction and solar angle as additional variables that shift both temperature curves and evaporation rates. Those who incorporate these elements into their planning frameworks maintain longer operational ranges across procedurally generated desert expanses.
Conclusion
Plotting temperature fluctuation cycles alongside hydration levels provides a structured framework for expedition planning in desert survival simulations. The approach combines environmental modeling with resource tracking to produce actionable schedules that align player actions with simulated natural rhythms. Continued refinement of these methods occurs through community data sharing and developer updates that expand variable complexity while preserving core predictive utility.